The Tree of Life (According to Google)
Project Overview
In recent years, there have been a variety of projects that attempt to document and visualize the tree of life. The University of Arizona, for example, hosts the Tree of Life Web Project (TOL), which attempts not only to document the tree of life but also to centralize the large amount of historical and genetic information available on the internet. Researchers at the University of Texas have also created a nice visualization of an arbitrarily representative sampling from the tree of life (visit the page here).
From a human perspective, some species in the tree of life are more important than others. The importance can be defined both historically (the line from which we derive) and scientifically (the species that we study the most). Our project visualizes the latter, drawing from Google as a representative sample of widely available human knowledge--and thus the number of Google search results as indicators of the relative importances in the tree of life. We thus attempt to answer (or enable one to answer):
- Which parts of the tree contain more information than others? Which branches are deeper?
- How does the amount of general knowledge (Google) compare to the amount of scientific or scholarly knowledge (Google Scholar)?
Data Aquisition
Given the immensity of the tree of life as documented on the TOL site (75,000+ nodes), we decided to focus on a small part of the tree, namely Eubacteria and its descendents. The tree is organized cladistically and does not contain the end nodes of species, so we ended up with a manageable 750+ nodes. To scrape the nodes and query google, we wrote a Python script using the Beautiful Soup library. We also downloaded the XML file for Eubacteria from the TOL site's web services and parsed it using the xml.sax package in Python. (In retrospect, it would have been easier to work directly with the XML file from the outset).
Visualization Approach
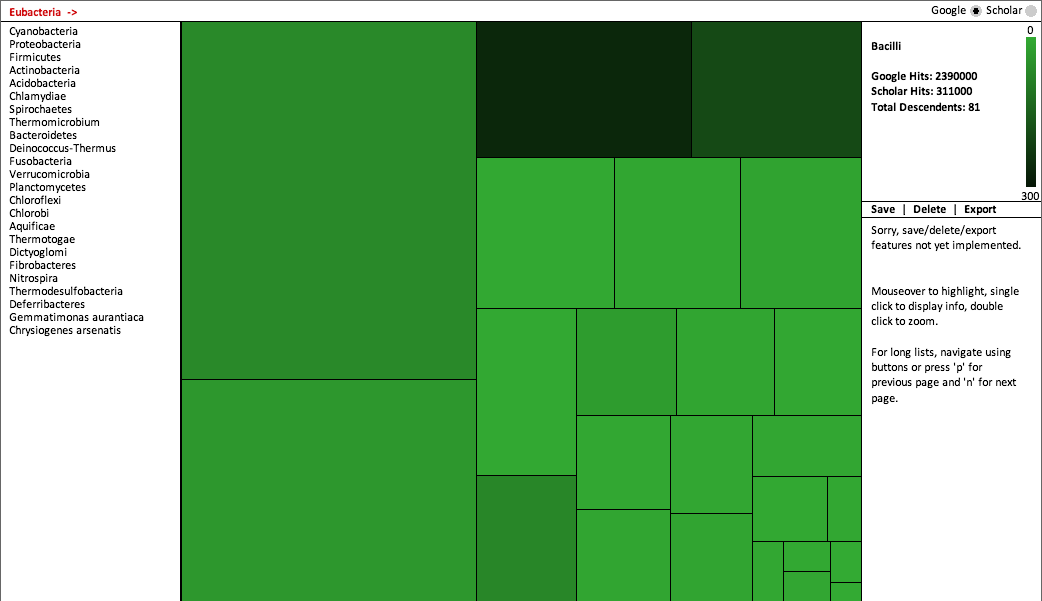
Our original conception was to visualize each interactive "level" of the Eubacteria branch using a Voronoi treemap. However, the implementation of Lloyd's algorithm for weighting proved a bit beyond the scope of this project. So instead, we wrote a Python script to prepare a squarified treemap based on the tiling algorithm described here. Among all rectilinear treemaps, the squarified treemap has the advantage of preserving aspect ratios as close to one as possible, thereby allowing easier comparison of areas. The squarified treemap is also conveniently ordered (in our case, by the number of Google hits in descending order).
The final rendering was written in Java using Processing. Users may switch between visualizations of Google and Google Scholar results; they may also click each node to display information and double click to zoom in on its children. Because some maps had many nodes--and consequently tiles that were very small--we implemented a linked list that also allows users to navigate the tree using text.
>>
Notes
- Scraping hits from Google Scholar posed a logistical challenge. Even with relatively long, variable search intervals (e.g. 5-20 seconds), Google Scholar recognized the Python script as a bot and would block our IP address, often necessitating a CAPTCHA or simply a long wait before attempting to recommence scraping. In our trials, Google Scholar would also return a null page on a periodical basis without necessarily blocking the IP. We did not experience any such difficulties with the regular Google search engine.
- The textual list is sorted in descending order of Google hits; ideally, the list would be reordered dynamically along with the treemap when the user switches to the view of Google Scholar. On a similar note, a better visualization would allow for some sort of visual comparison between Google and Google Scholar treemaps.
- Treemaps commonly represent one or more "sublevels" at any given moment (i.e., children/descendants are drawn within each node, as with this famous map of the market). Largely because we implemented the squarified treemap algorithm ourselves rather than building off of a pre-existing library, we did not have time to build in sublevels. However, the usefulness of representing even the children of any node is not always clear. When a map contains close to 100 nodes, for example, it becomes very difficult to highlight or even distinguish many nodes on the current level--let alone their children. Given the nature of the tree of life, our approach of representing only the current level allows for a large degree of clarity. But perhaps the best solution is to display children with interaction on demand, for example by right-clicking any given node.
- Our model of interactive treemap is probably more suited to representing a taxonomic system rather than a cladistic one, since cladistic systems may be arbitrarily deep and require many diverging branches for meaningful representation. A related problem is the lack of a macro perspective, as our visualization cannot represent different branches or groups of nodes at the same time. To mitigate this problem. we have envisioned a save/export function, whereby the user may select any node and save its data for analysis using external programs (e.g. Excel).
- In addition to what has been noted above, we were unable to implement some details due to time constraints, such as: text overlay on larger nodes to display name or number of children; more suitable color scale for better visual distinction between nodes; more consistent list behavior.